In 1999, the world population reached 6 billion people. We are now over 7 billion and expected to reach 8 billion in 2024.
Taking into account the world’s population size and distribution is vital for most environmental studies.

Free Pre-K-12 lesson plans, activities, and resources
In 1999, the world population reached 6 billion people. We are now over 7 billion and expected to reach 8 billion in 2024.
Taking into account the world’s population size and distribution is vital for most environmental studies.
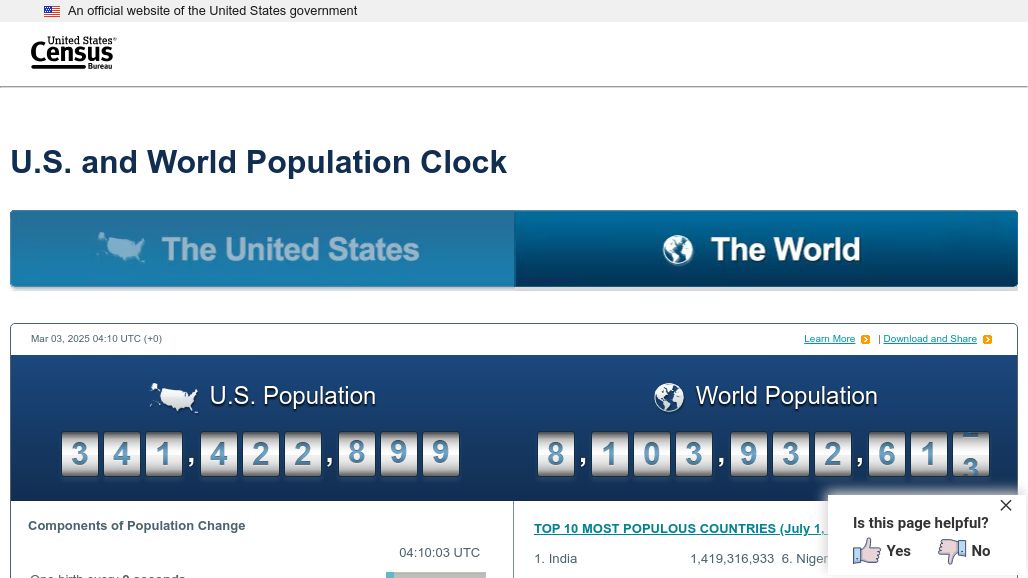
An interesting page is the "POPClock" from the U.S. Census Bureau. As soon as the site is entered, a population ticker is activated; it just keeps going and… learn more
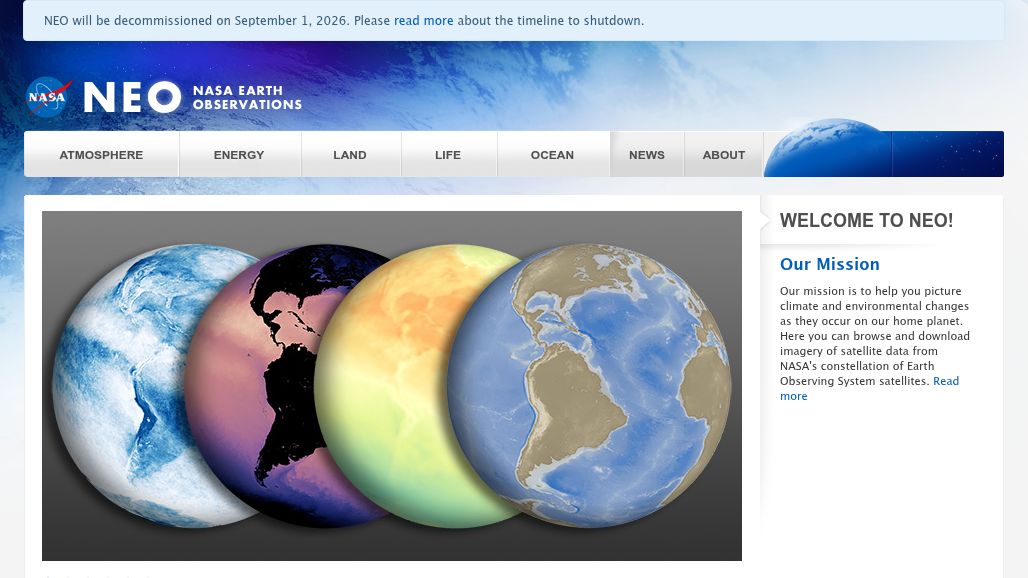
NASA Earth Observations (NEO), One of the best places to study Earth is from space. NASA satellites continually orbit the globe, collecting information about Earth’s ocean, atmosphere, and… learn more
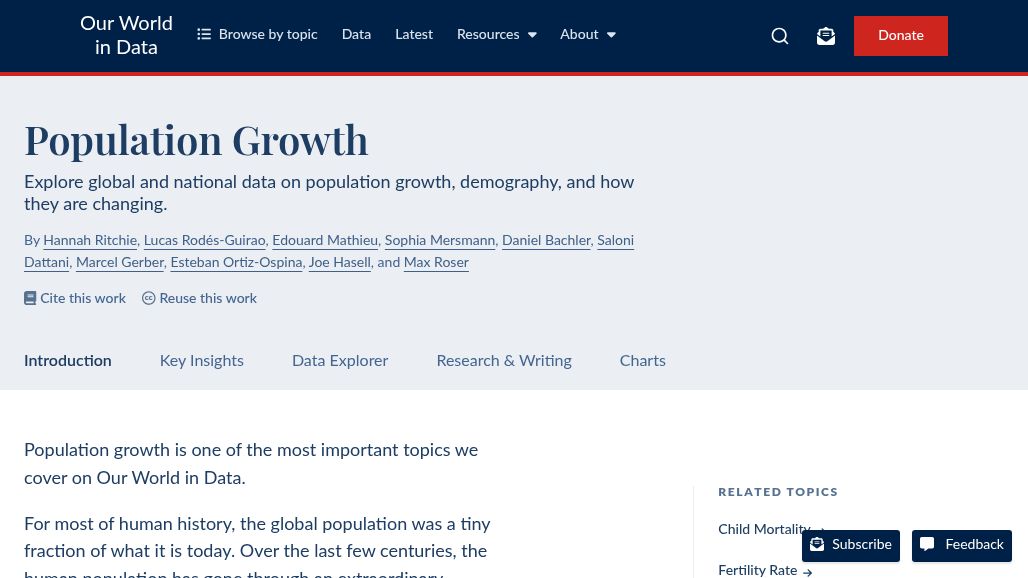
Our World in Data breaks out population growth and future projections by country, age and more. Includes a wide range of graphs, maps, and data sources for further… learn more
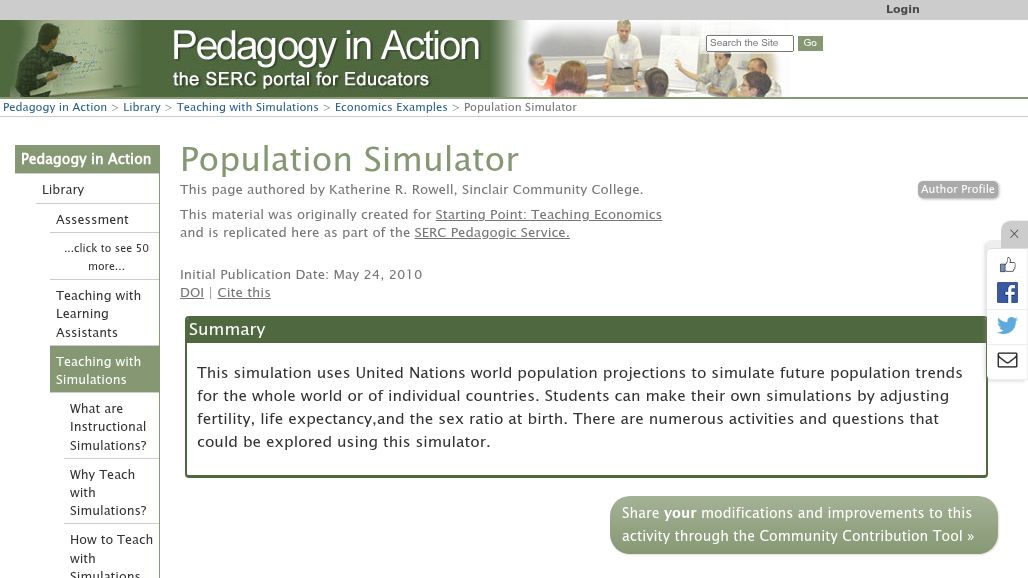
Learning Goals This is a simulation tool for explaining numerous demographic terms including mortality rate,life expectancy, fertility rate, infant mortality, and the sex ratio. The simulator could also… learn more
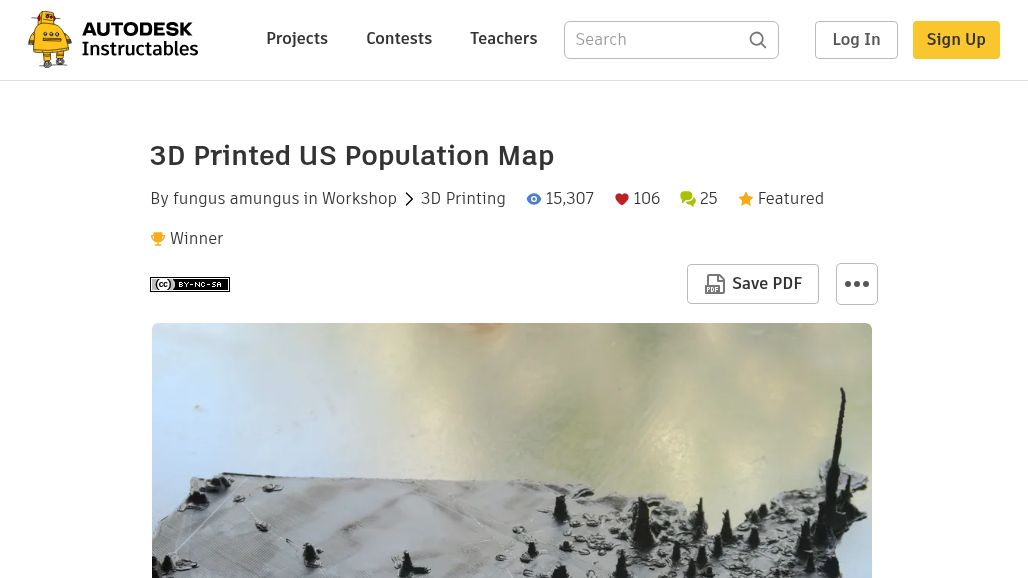
The United States is a big place and it's hard to have a feeling for where all of the people live. There are hundreds of millions of people… learn more
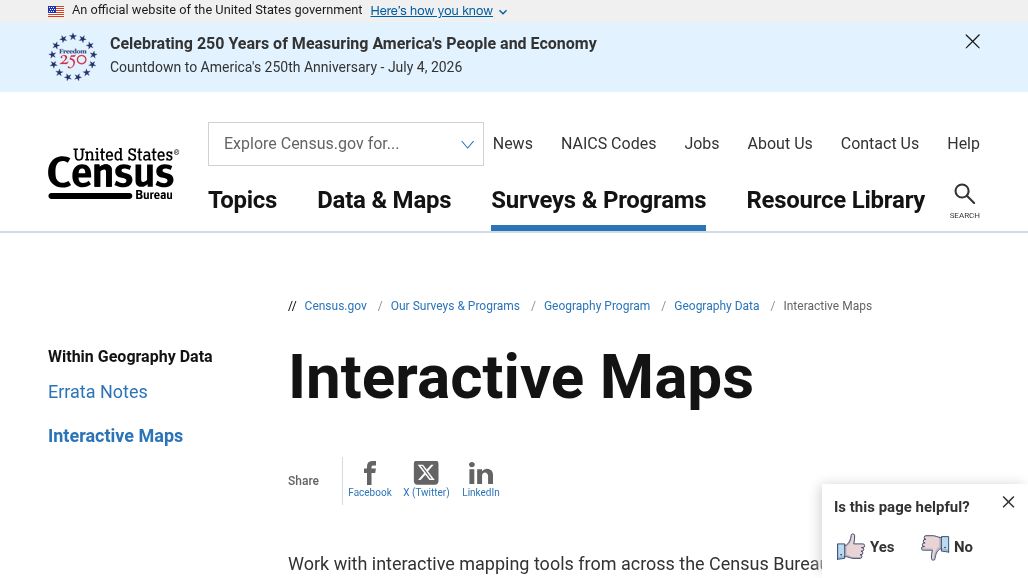
The U.S. Census Bureau has a series of maps that lets you do things like visualize population growth by county, learn about Rural America, and track current emergencies… learn more
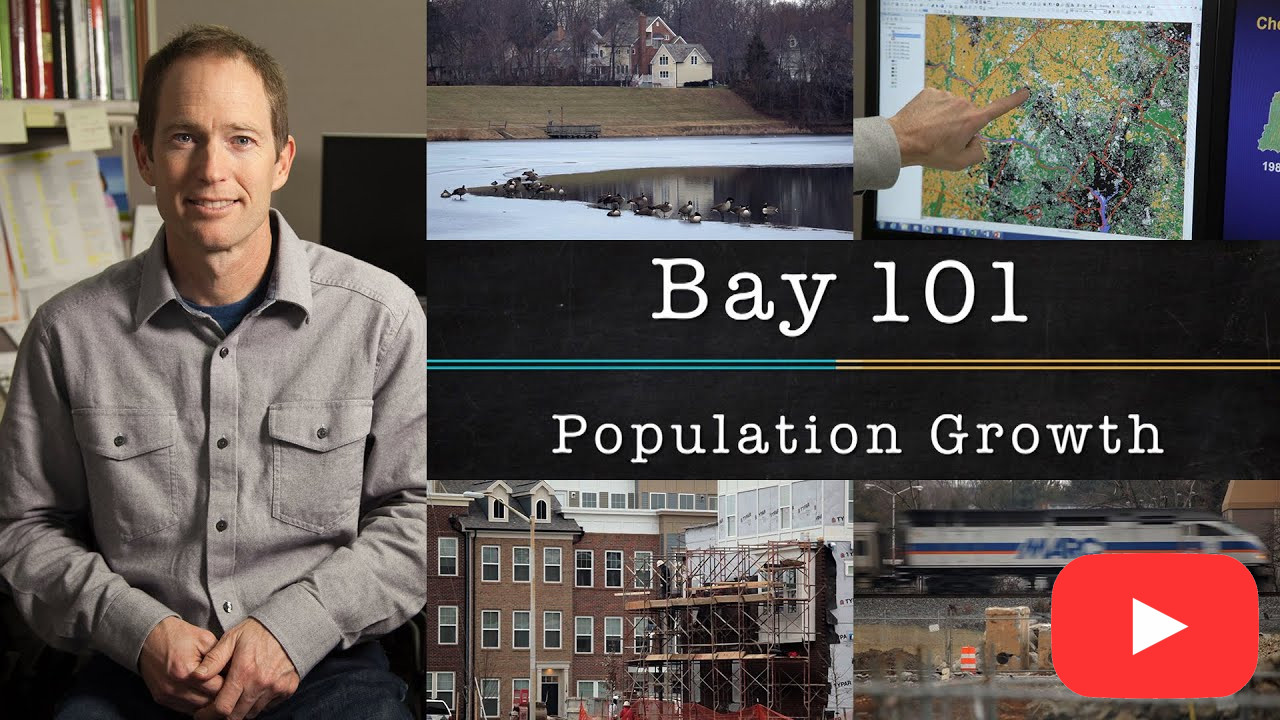
Geographer Peter Claggett with the U.S. Geological Survey (USGS) show how the population of the the Chesapeake Bay has grown using satellite imagery and talks about what people… learn more
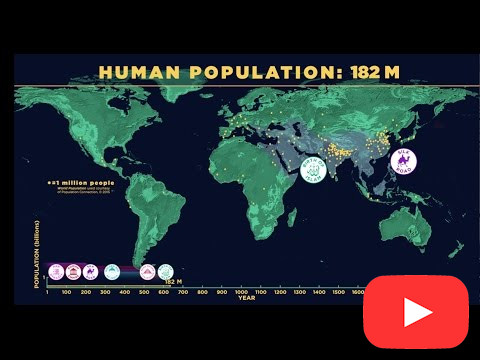
It took 200,000 years for our human population to reach 1 billion—and only 200 years to reach 7 billion. The American Museum of Natural History produced this amazing… learn more
No websites match your current filters
– no items filtered –